Playing with the new Windows Azure Storage Analytics Features

As I’m learning about these new capabilities, I’m putting the results of my experiments online at http://storageanalytics.cloudapp.net. This app lets you change your analytics settings (so you’ll need to use a real storage account and key to log in) and also lets you graph your “Get Blob” metrics.
A couple notes about using the app:
- When turning on various logging and analytics features, you’ll have to make sure your XML conforms with the documentation. That means, for example, then when you enable metrics, you’ll also have to add the
<IncludeAPIs />tag, and when you enable a retention policy, you’ll have to add the<Days />tag. - The graph page requires a browser with
<canvas>tag support. (IE9 will do, as will recent Firefox, Chrome, and probably Safari.) Even in modern browsers, I’ve gotten a couple bug reports already about the graph not showing up and other issues. Please let me know on Twitter (I’m @smarx) if you encounter issues so I can track them down. Bonus points if you can send me script errors captured by IE’s F12, Chrome’s Ctrl+Shift+I, Firebug, or the like. - The site uses HTTPS to better secure your account name and key, and I’ve used a self-signed certificate, so you’ll have to tell your browser that you’re okay with browsing to a site with an unverified certificate.
In the rest of this post, I’ll share some details and code for what I’ve done so far.
Turning On Analytics
There’s a new method that’s used for turning analytics on and off called “Set Storage Service Properties.” Because this is a brand new method, there’s no support for it in the .NET storage client library (Microsoft.WindowsAzure.StorageClient namespace). For convenience, I’ve put some web UI around this and the corresponding “Get Storage Service Properties” method, and that’s what you’ll find at the main page on http://storageanalytics.cloudapp.net.
If you want to write your own code to change these settings, the methods are actually quite simple to call. It’s just a matter of an HTTP GET or PUT to the right URL. The payload is a simple XML schema that turns on and off various features. Here’s the relevant source code from http://storageanalytics.cloudapp.net:
[OutputCache(Location = OutputCacheLocation.None)]
public ActionResult Load(string service)
{
    var creds = new StorageCredentialsAccountAndKey(Request.Cookies["AccountName"].Value,
        Request.Cookies["AccountKey"].Value);
    var req = (HttpWebRequest)WebRequest.Create(string.Format(
        "http://{0}.{1}.core.windows.net/?restype=service&comp=properties",
        creds.AccountName, service));
    req.Headers["x-ms-version"] = "2009-09-19";
    if (service == "table")
    {
        creds.SignRequestLite(req);
    }
    else
    {
        creds.SignRequest(req);
    }

    return Content(XDocument.Parse(new StreamReader(req.GetResponse().GetResponseStream())
        .ReadToEnd()).ToString());
}

[HttpPost]
[ValidateInput(false)]
public ActionResult Save(string service)
{
    var creds = new StorageCredentialsAccountAndKey(Request.Cookies["AccountName"].Value,
        Request.Cookies["AccountKey"].Value);
    var req = (HttpWebRequest)WebRequest.Create(string.Format(
        "http://{0}.{1}.core.windows.net/?restype=service&comp=properties",
        creds.AccountName, service));
    req.Method = "PUT";
    req.Headers["x-ms-version"] = "2009-09-19";
    req.ContentLength = Request.InputStream.Length;
    if (service == "table")
    {
        creds.SignRequestLite(req);
    }
    else
    {
        creds.SignRequest(req);
    }

    using (var stream = req.GetRequestStream())
    {
        Request.InputStream.CopyTo(stream);
        stream.Close();
    }

    try
    {
        req.GetResponse();
        return new EmptyResult();
    }
    catch (WebException e)
    {
        Response.StatusCode = 500;
        Response.TrySkipIisCustomErrors = true;
        return Content(new StreamReader(e.Response.GetResponseStream()).ReadToEnd());
    }
}
You can find a much more complete set of sample code for enabling and disabling various analytics options on the storage team’s blog posts on logging and metrics, but I wanted to show how straightforward calling the methods can be.
Reading the Metrics
The new analytics functionality is really two things: logging and metrics. Logging is about recording each call that is made to storage. Metrics are about statistics and aggregates. The analytics documentation as well as the storage team’s blog posts on logging and metrics have more details about what data is recorded and how you can use it. Read those if you want the details.
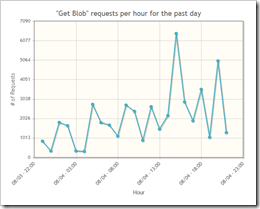
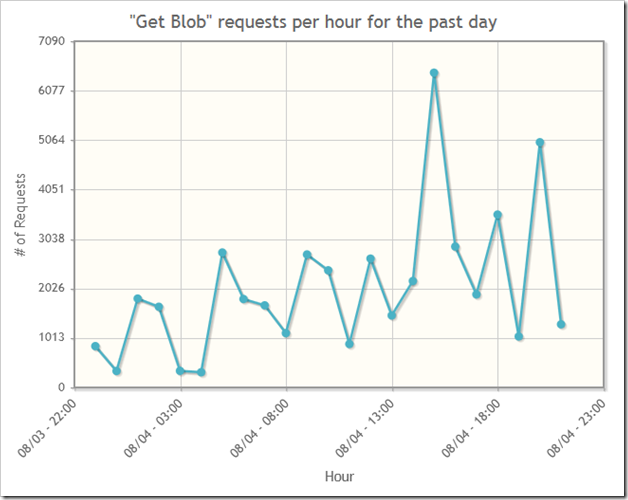
For http://storageanalytics.cloudapp.net, I created just one example of how to use metrics. It draws a graph of “Get Blob” usage over time. Below is a graph of how many “Get Blob” calls have been made via http://netflixpivot.cloudapp.net over the past twenty-four hours. (Note that http://netflixpivot.cloudapp.net is a weird example, since most access goes through a CDN. I think a large number of the requests below are actually generated by the backend, which is doing image processing to construct the Deep Zoom images, involving a high number of calls directly to storage and not through the CDN. This explains the spikiness of the graph, since the images are reconstructed roughly once per hour.)
You can see a similar graph for your blob storage account by clicking on the graph link on the left of http://storageanalytics.cloudapp.net. This graph is drawn by the excellent jqPlot library, and the data is pulled from the $MetricsTransactionsBlob table.
Note that the specially named $logs container and $Metrics* family of tables are simply regular containers and tables within your storage account. (For example, you’ll be billed for their use.) However, these containers and tables do not show up when you perform a List Containers or List Tables operation. That means none of your existing storage tools will show you these logs and metrics. This took me a bit by surprise, and at first I thought I hadn’t turned on analytics correctly, because the analytics didn’t seem to appear in my storage explorer of choice (the ClumsyLeaf tools).
Here’s the code from http://storageanalytics.cloudapp.net that I’m using to query my storage metrics, and specifically get the “Get Blob” usage for the past twenty-four hours:
public class Metrics : TableServiceEntity
{
    public string TotalRequests { get; set; }
    public Metrics() { }
}
...
IEnumerable<Metrics> metrics = null;
try
{
    var ctx = new CloudStorageAccount(new StorageCredentialsAccountAndKey(
        Request.Cookies["AccountName"].Value,
        Request.Cookies["AccountKey"].Value), false).CreateCloudTableClient().GetDataServiceContext();
    metrics = ctx.CreateQuery<Metrics>("$MetricsTransactionsBlob").Where(m =>
        string.Compare(m.PartitionKey,
            (DateTime.UtcNow - TimeSpan.FromDays(1)).ToString("yyyyMMddTHH00")) > 0
        && m.RowKey == "user;GetBlob").ToList();
}
catch { } // just pass a null to the view in case of errors... the view will display a generic error message
return View(metrics);
I created a very simple model (just containing the TotalRequests property I wanted to query), but again, the storage team’s blog post on metrics has more complete source code (including a full class for reading entities from this table with all the possible properties).
Download the Source Code
You can download the full source code for http://storageanalytics.cloudapp.net here: http://cdn.blog.smarx.com/files/StorageAnalytics_source.zip
More Information
For further reading, consult the MSDN documentation and the storage team’s blog posts on logging and metrics.

 about me (Steve Marx)
